
Global equities
There were twists and turns in market leadership throughout 2025 and while performance broadened out from the US mega cap stocks, it still proved to be a difficult year for active global equities managers.
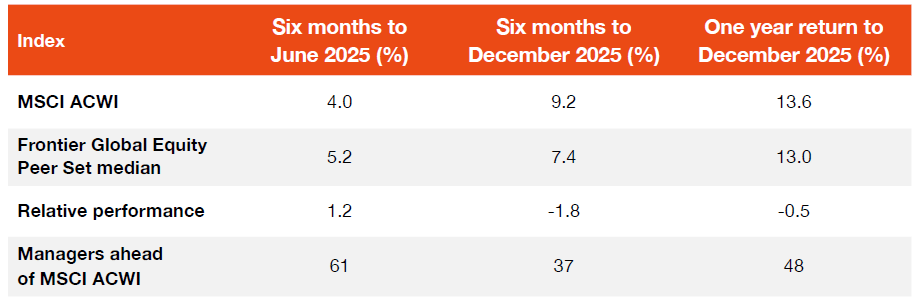
The median manager in Frontier’s Global Equities Peer Set lagged the MSCI ACWI index by -0.5% over the year to 31 December 2025. While a negative result, this nonetheless marked an improvement from the historically poor year for active management in global equities in 2024, when the median manager trailed the benchmark by -4.6%.
As we highlighted in our FY25 active management paper, green shoots emerged in the first half of 2025 as managers clawed back some alpha, particularly during the March quarter when the market rotated away from the US and towards Europe. However, these green shoots were decisively squashed in the ensuing September quarter, which produced the worst active management outcome on record for global equities in the Frontier Peer Set (-2.0% at the median level). The table below summarises active management results in global equities.
Frontier Global Equity Peer Set returns against the MSCI ACWI (AUD)
While the headline results were disappointing, 2025 saw a strong resurgence from value managers who, at the median level, outperformed growth managers (and the ACWI benchmark) in both halves. This outperformance was particularly pronounced during the second half of 2025 as cyclical stocks rallied, led by materials, while the fate of AI-exposed stocks was more mixed (e.g. the semiconductor and tech hardware industries outperformed while software and services retraced). Over the full year, value managers outperformed growth managers by 13.3% at the median level, returning to the winner’s column in a big way after a couple of strong calendar years from growth. Importantly, the median value manager in the Frontier Global Equities Peer Set delivered 5.2% of alpha over the year, while the median growth manager lagged the ACWI benchmark by -8.1%.
Growth and value cohort returns in global equities
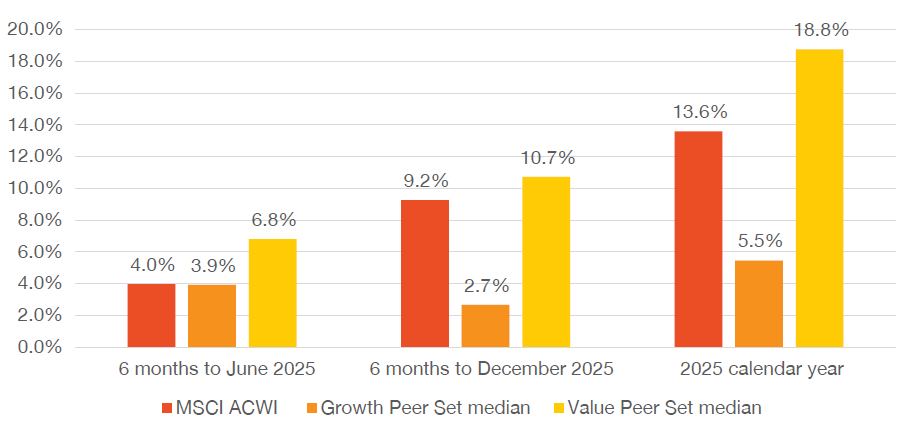
Notably, however, the sizeable outperformance from value managers in 2025 was at odds with the performance of the value factor, with the returns of the MSCI ACWI Value index broadly matching those of the MSCI ACWI Growth index. This is highly unusual as we typically observe a strong relationship between the performance of these MSCI factor indices and the performance of our manager cohorts. This suggests the drivers of active management outcomes in 2025 went beyond the performance of value and growth factors, notwithstanding some of the limitations of these naïve factor indices.
Emerging markets
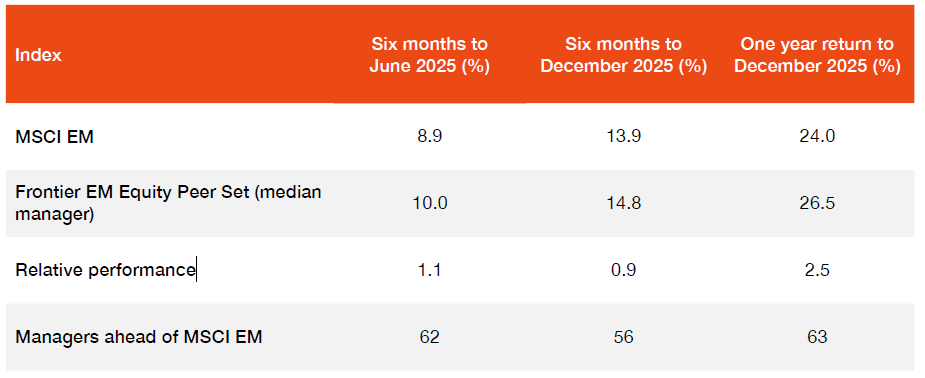
Managers in EM continued on from their solid first half of 2025, posting another healthy level of excess returns in the second half. The median EM manager finished the half 0.9% ahead of the MSCI EM Index, which combined with the +1.1% result in the first half led to overall gains of +2.5% at the median level. This level of alpha alongside the outperformance of EM as a whole relative to developed markets has provided a welcome total return reprieve for asset owners with dedicated EM allocations with the median EM manager returning 26.5%, almost double the MSCI ACWI’s return of 14.0%.
Frontier’s Emerging Markets Equity Peer Set returns against the MSCI EM index
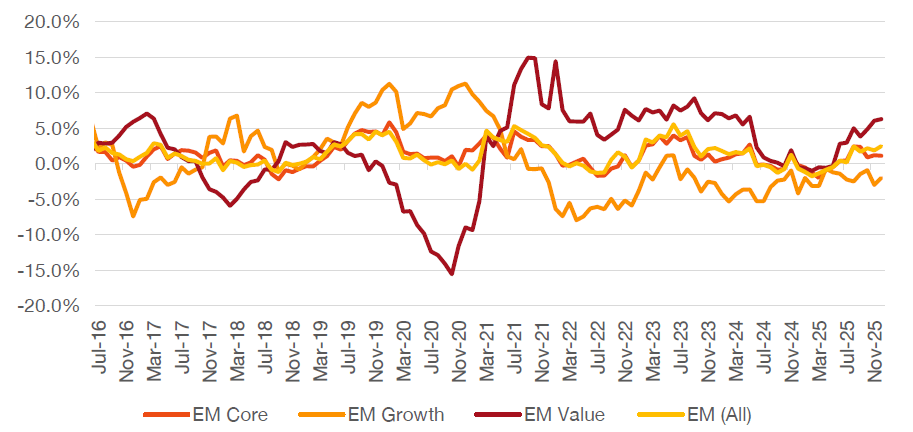
The chart below shows the median manager returns by investment style over this period. Here we can see it was the performance of value managers that really shined within EM over the period, with the median manager posting alpha across each of the four quarters to end the year with 6.3% in excess returns. This outperformance of value managers has been part of a multi-year trend within EM which has been in contrast to developed markets.
Median manager excess returns relative to MSCI EM index
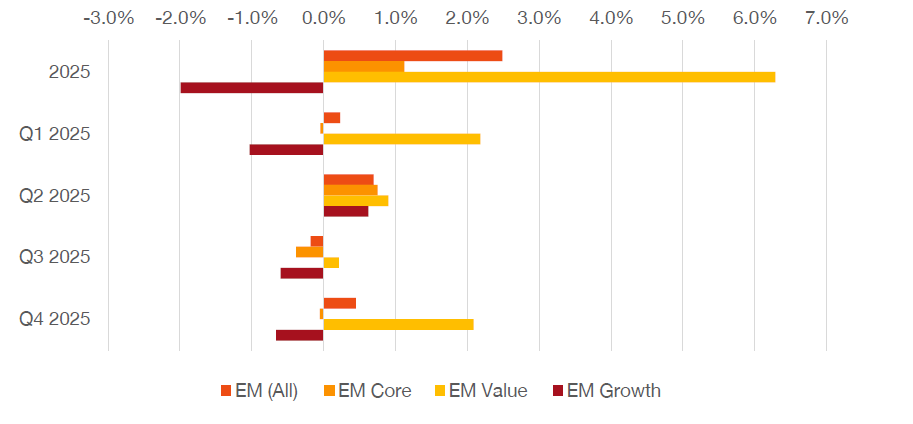
The alpha profile of the median EM core manager was slightly more volatile across the four quarters, delivering 1.1% alpha over the financial year despite posting negative excess returns for all bar the second quarter. The median EM growth manager underperformed the MSCI EM index by 2.0% over the period, with its modest 0.6% alpha in the June quarter insufficient to overcome the headwind of its three other quarters of underperformance during the year.
Median manager rolling 12-month excess returns relative to MSCI EM
Australian equities
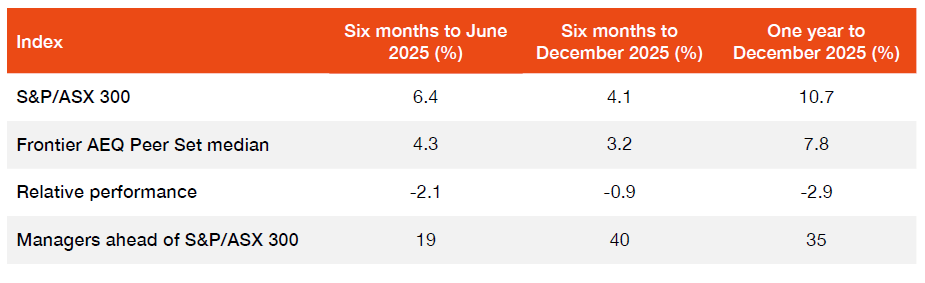
The news doesn’t get any better when it comes to Australian equity managers, a challenging first half of the year only continued into the second half leading to the worst year we’ve seen for Australian managers on record. While active managers have long been navigating concentrated benchmarks in our local market, what’s changed is the narrowness in performance drivers, with the banks alongside a resurgent materials sector driving disproportionate index returns. In a particularly dour year, only slightly more than a third of broad cap Australian equity managers were able to beat the index return.
Frontier Australian Equity Peer Set performance against S&P/ASX 300
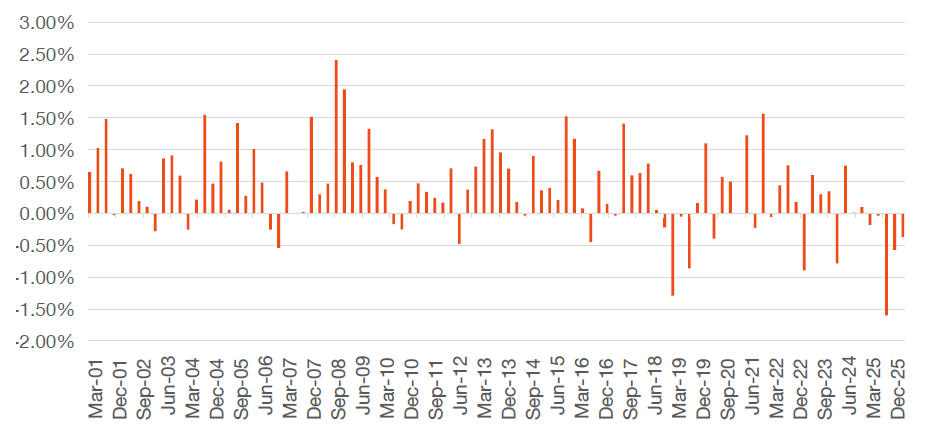
The severity of the weakness in the June quarter can be seen in the chart below, which shows quarterly median excess returns within Frontier’s Australian Equities Peer Set. The S&P/ASX 300 delivered a mighty 9.5% return in the June quarter as the index set fresh record highs. The poor active management outcomes were likely the result of typical underweight sectors outperforming (financials and REITs) while the health care sector was a notable detractor. Notably, a shift in market leadership in the second half of the year provided little respite for managers, with the outperformance of large index constituents such as BHP, Evolution Mining and Northern Star Resources compounding challenges.
Such was the pervasiveness of the challenges faced by active managers that the median manager in Frontier’s Australian Equities Peer Set underperformed in each of the four quarters across the year, the first such time this has occurred since we began collecting data.
Australian Equity Peer Set median quarterly excess return (vs S&P/ASX 300)
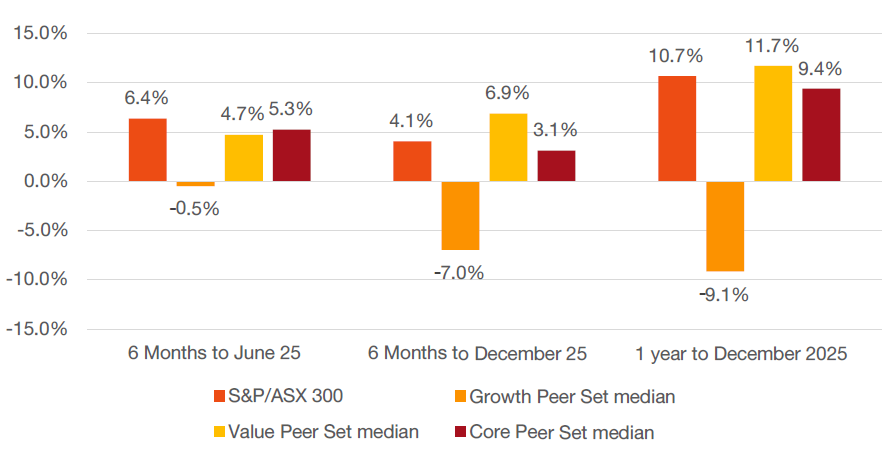
The next chart shows value managers in Australian markets had a more productive financial year than their growth counterparts, providing a small bright spot for performance in 2025. The outperformance of the value cohort over the year was driven primarily by deep value managers who tended to hold a higher exposure to the materials sector and in particular, gold stocks which outperformed considerably over the year. While growth managers underperformed over the first half, their second half underperformance was particularly pronounced. Their limited exposure to materials stocks was often coupled with positions in well held names such as CSL, WiseTech, James Hardie and Goodman Group, all of which detracted from returns. Such was the challenge of narrowness in the market that even core managers who typically manage their portfolios with a more style balanced approach, materially underperformed over the year.
Peer Set returns in Australian equities across style cohorts
The final word
On the whole, 2025 was an underwhelming year for active management outcomes as the median global equities manager and the median Australian equities manager underperformed their respective benchmarks.
The one bright spot, however, was emerging markets, where the median manager delivered alpha on top of EM returns that were ahead of developed markets.
In the case of global equities, the narrative finally shifted from market concentration and US exceptionalism that drove returns in 2023 and 2024. However, this brought new challenges, and we observed managers struggle through a combination of sector allocation and stock selection. It was a slightly different story in Australian equities over the year, with an underweight to the big four banks and an exceptionally strong gold trade, leading the most challenging year for managers in over 20 years.
This paper serves as a reminder to investors that active management outcomes can be cyclical, though we understand at times (such as 2025) the decline can seem structural. We also highlight factors beyond traditional style biases affect performance relative to equity benchmarks. Frontier believes it is important to assess individual active management performance not only against style peers, but equally against a whole other range of factors (market breadth, country/sector leadership and size impacts) which ultimately can impact benchmark relative outcomes.
Our Equities Team is available to discuss our curated peer set service in more detail with interested clients. If you want to discuss this paper in more detail, please reach out to your consultant or a member of Frontier’s Equities Team.