

Global equities
The 2026 financial year will not be remembered fondly by active global equities managers.
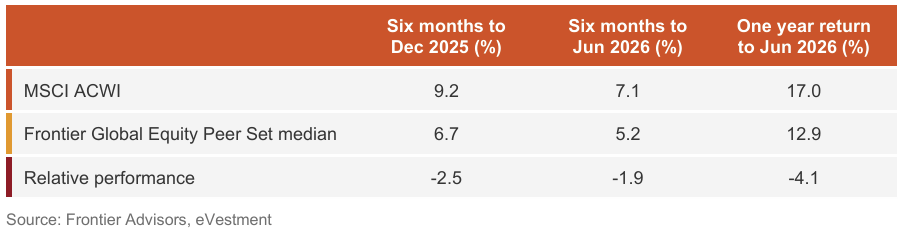
Despite hopes that the market rotation away from US mega caps would restore more favourable conditions for stock pickers, the median manager in Frontier’s Global Equities Peer Set trailed the MSCI ACWI index by -4.1% over the year to 30 June 2026. This represents the worst financial year result in the more than 25 years of our Peer Set history, eclipsing the previous low set in FY24 (1.3%). Only 34% of managers outperformed the benchmark over the year. Table 1 summarises active management results in global equities.
Frontier Global Equity Peer Set returns against the MSCI ACWI (AUD)
Value managers outperformed growth managers for a second consecutive year, though the type of value exposure mattered. Deep value managers benefited from exposure to lower-valued parts of the AI supply chain, particularly Korean memory companies, alongside selected small-cap commodity and energy businesses. These positions more than offset their longstanding underweight to technology and assisted them in outperforming their moderate value peers over the year.
Growth managers had less exposure to these areas and were instead concentrated in high-quality software, payments, healthcare technology and consumer businesses that came under pressure as capital rotated towards AI infrastructure. Interestingly, it was high growth managers that fared better than moderate growth managers. The key lesson is that style labels alone did not explain outcomes. Performance was driven by the specific companies and business models managers owned within each style.
Emerging markets
Emerging markets delivered their strongest financial year in two decades, with the MSCI EM index returning 35.7%, its best result since FY06 and almost 19% ahead of the MSCI ACWI.
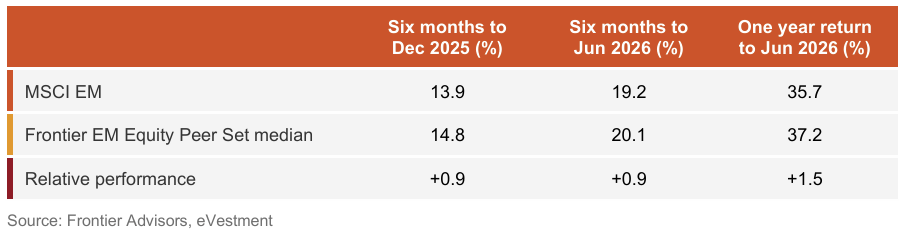
Better still for asset owners with dedicated EM allocations, active managers added value on top. The median manager in Frontier’s EM Equities Peer Set returned 37.2%, outperforming the index by 1.5% for the year, with 56% of managers ahead of the benchmark. After matching the index in the September quarter, the median manager delivered positive excess returns in each of the three remaining quarters. This is an impressive result given, as we explore in the full paper, the extreme narrowness of the EM market in FY26.
Frontier’s Emerging Markets Equity Peer Set returns against the MSCI EM index
This result stands in contrast with outcomes in global equities, despite very similar drivers in benchmark returns. In fact, EM was, on most measures, even narrower than the global market in FY26. The MSCI EM Equal Weighted index returned just 15.1% against 35.7% for the cap-weighted index, EM IT returned 148%, and the index’s returns were dominated by the same AI hardware trade that hurt global managers.
In EM, this was concentrated squarely in the memory and chip names: Taiwan (93.9%), Korea (KOSPI 161%) and little else. India, the market’s darling of recent years, fell -17.5%, and Chinese H shares were flat. Yet where the median global manager had their worst year on record, the median EM manager delivered positive excess returns. The difference, visible in the underlying portfolio holdings, is EM managers owned the trade. At 30 June 2025, the median EM manager held SK Hynix as an overweight (+0.6% median active weight, with 71% of managers holding it), was roughly neutral Samsung Electronics (+0.2%), and carried only a modest median underweight to TSMC (-0.8%). This positioning contrasts sharply with their global counterparts, who were underweight the entire complex.
Value managers again led emerging markets, although conventional style indices did not explain the result. Their valuation discipline left them well positioned in Korea’s AI-related memory companies and underweight the more expensive Indian market, placing them on the right side of the year’s two most consequential country exposures. Towards the end of the year, we saw value managers in aggregate move underweight the memory complex, demonstrating an expected but timely execution of their valuation discipline as the AI/Korean trade turned.
Growth managers faced the reverse positioning. They held less exposure to Korea and remained invested in quality compounders across India and other domestic-growth markets, which lagged as returns narrowed around Asian technology. The key distinction was therefore not broad value versus growth exposure, but how each cohort accessed the AI theme and responded to valuation differences across markets.
Australian equities
There was no reprieve for Australian equity managers in FY26.
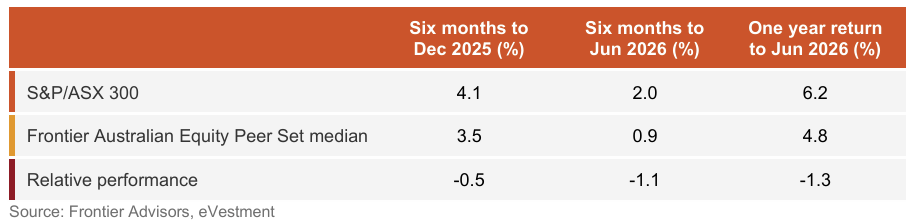
The median broad-cap manager in Frontier’s Australian Equities Peer Set returned 4.8% against 6.2% for the S&P/ASX 300. This underperformance of -1.3% marks the third consecutive negative financial year for the cohort, with only 36% of managers ahead of the benchmark. The result was an improvement on FY25’s record financial year low (-3.3%), and notably also an improvement on the one-year median outcomes earlier in the year (which bottomed out in February 2026 at -5.5%). Nonetheless, the more sobering observation is the run. After two decades in which the median Australian manager reliably added value, the last three financial years have now all finished in the red owing to the market structure dynamics we discussed in our most recent 2026 Australian Equity configuration review (available to Frontier clients via Frontier’s Partners Platform).
Frontier Australian Equity Peer Set performance against S&P/ASX 300
The characteristics of the year were familiar. Market leadership narrowed into segments that active managers did not fully own, while several long-standing quality-growth exposures detracted. The difference in FY26 was the problem shifted. FY25 was dominated by the banks. FY26 was more about resources, set against a sharp drawdown in health care, software and other high-multiple compounders. That combination left the median manager squeezed from both sides – insufficient exposure to the strongest parts of the market, and continued exposure to parts of the market that were being de-rated.
Value managers were the clear winners in Australian equities, benefiting from greater exposure to resources and energy as market leadership shifted away from banks. Growth managers were hit hardest by sharp declines across technology, healthcare and other highly valued quality businesses, while core managers were also affected by exposure to these areas and limited participation in parts of the resources rally.
The final word
FY26 produced the most extreme divergence in active management outcomes we have recorded. The median global equities manager suffered the worst financial year in the history of our Peer Set (4.1% median excess return), Australian managers posted a third consecutive year of underperformance (-1.3%), and yet emerging markets managers delivered healthy excess returns
(+1.5%) on top of the strongest EM returns in two decades. Unsurprisingly, all three outcomes trace to the same phenomenon – a global AI hardware super cycle, centered on the memory names of Korea and the semiconductor complex of Taiwan and the US, that produced one of the narrowest and most
momentum-driven markets on record. Where managers owned the trade, as EM managers broadly did, active management prospered; where they were structurally absent from it, as global managers were in North Asia and Australian managers were in the miners, even correct calls elsewhere could not compensate.
The year also challenged the traditional style lens. The MSCI Value and Growth indices finished within a percentage point of each other in global equities and within two in EM, yet value manager cohorts beat growth cohorts by roughly 13% in global equities and by about 10% in EM. In terms of naive factor indices, momentum (+44.0%) and minimum volatility (-2.4%) set the true boundaries of the year. The underlying portfolio holdings show the divide that mattered ran through positioning in a handful of stocks within every style cohort, not between them. These stocks related to the AI hardware complex, gold miners, and traditional quality compounders. The record dispersion of manager outcomes, most extreme in EM, makes the same point from a different angle – in FY26, manager selection mattered more than style allocation.
This paper serves, as ever, as a reminder that active management outcomes are cyclical, even when the drawdowns feel structural. But it also carries a newer message. Active managers in aggregate ended FY26 positioned further from the benchmark’s dominant trade than they began it, most clearly in emerging markets, where managers trimmed the memory names hardest as they re-rated, even as index concentration reached record levels in every market we cover. Whether FY27 rewards discipline or punishes it will depend on how the AI trade resolves.
Frontier believes the appropriate response for investors is not to abandon style diversification but to assess each manager against the full set of factors that drove this extraordinary year – market breadth, country and sector leadership, size effects, and above all positioning in the handful of stocks now dominating benchmarks – rather than against style peers alone.
Frontier curates granular style based peer sets in Australian, global and emerging equity markets to better understand active management outcomes for clients, while also taking into account the prevailing market environment. Through the elimination of duplicates and rigorous analysis of the underlying manager constituents to ensure correct style classification, we believe these curated lists and the underlying peer set performance provide investors with greater insight into the performance of their active managers. These cohorts exist at a more granular level than what is presented in this paper. New this year, the analysis is underpinned by a mapping of every reported portfolio holding of every manager in the peer sets to the benchmark – allowing positioning statements in this paper to be measured across the full peer set rather than sampled. If you want to discuss this paper in more detail, please reach out to your consultant or a member of Frontier’s Equities Team.